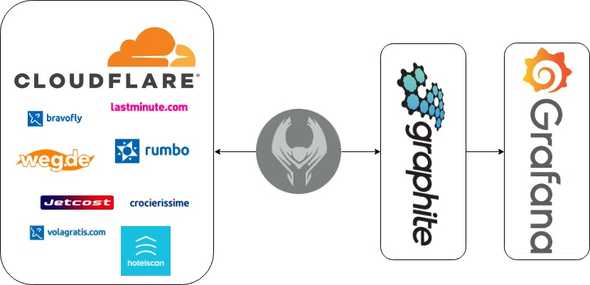
At lastminute.com we use Cloudflare as CDN for our websites; we have more than 30 top-level domains and over 800 third-level domains across our brands.
Using the Cloudflare web UI to monitor all of this traffic is not ideal although the Cloudflare dashboard is really nice.
We need a holistic monitoring view to give the best user experience to our customers and alerts to pinpoint problems or attacks on our network before they turn into a degraded service.
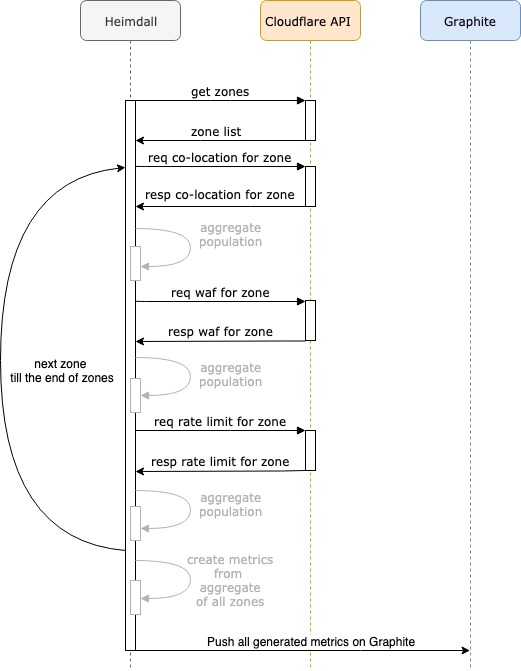
Heimdall is our solution: it is an application developed in Go that collects metrics from a Cloudflare account using the amazing Cloudflare API. Heimdall reads all the zones created in an account (automatically discovering new zones), gathers co-location metrics and pushes them in Graphite; metrics can then be visualized in dashboards to facilitate troubleshooting.
Co-location metrics offered by Cloudflare are:
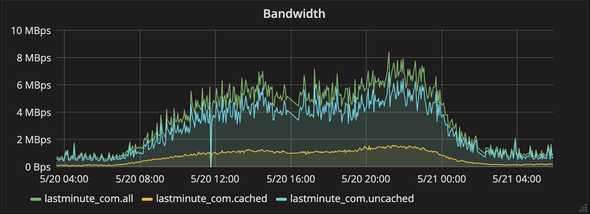
- bandwidth
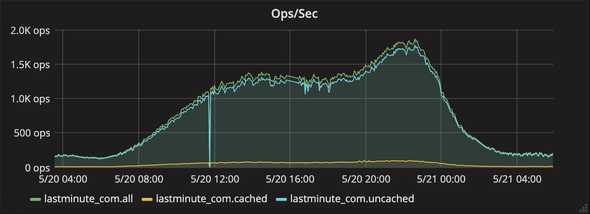
- operations/sec
- HTTP status codes
- WAF’s trigger count
- rate limit trigger count
they are grouped by Point-Of-Presence and summed up.
How it works
Heimdall runs following a scheduled cron syntax that you can configure; at every run it calls Cloudflare’s API to get the zone ids that are necessary to collect the co-location metrics by zone.
The results are then parsed and processed into metrics.
From data to metrics
Having to manage more than 800 third-level domains we created an aggregated metric on the top-level domains (30+), so that we have cleaner dashboards while keeping an efficient alerting based on the standard deviation.
Below here’s a snippet of metrics creation based on a zone aggregate
...

func AdaptDataToMetrics(aggregates []*model.Aggregate) []graphite.Metric {
 metrics := make([]graphite.Metric, 0)
 for _, aggregate := range aggregates {
  for date, counters := range aggregate.Totals {
   metrics = append(metrics, metric(aggregate.ZoneName, counters.RequestAll.Key, strconv.Itoa(counters.RequestAll.Value), date))
   ...

   for _, entry := range counters.HTTPStatus {
    metrics = append(metrics, metric(aggregate.ZoneName, entry.Key, strconv.Itoa(entry.Value), date))
   }

   for host, entry := range counters.WafTrigger {
    metrics = append(metrics, hostMetric(aggregate.ZoneName, host, entry.Challenge.Key, strconv.Itoa(entry.Challenge.Value), date))
    ...
   }

   for host, rateLimitsCounters := range counters.RateLimit {
    for _, entry := range rateLimitsCounters {
     metrics = append(metrics, hostMetric(aggregate.ZoneName, host, entry.Challenge.Key, strconv.Itoa(entry.Challenge.Value), date))
     ...
    }
   }
  }
 }

 return metrics
}

func metric(zone, key, value string, date time.Time) graphite.Metric {
 metricKey := strings.ToLower(fmt.Sprintf(defaultMetricsPattern, normalize(zone), key))

 return graphite.NewMetric(metricKey, value, date.Unix())
}
How to configure Heimdall
Heimdall needs a configuration file to set the schedule, the connection to Graphite service and the Cloudflare API. Configuration File example:
{
  "collect_every_minutes": "5",
  "graphite_config": {
    "host": "graphite",
    "port": 2113
  }
}
In the configuration you can specify how often to collect data from the previous period, in minutes (eg. with "collect_every_minutes": "5": Heimdall will start collecting data every 5 minutes for the past 5 minutes); graphite_config represent the minimum set of mandatory data to allow Heimdall to push the metrics on Graphite: address and port.
Environment variables:
export CLOUDFLARE_ORG_ID=<YOUR ORGANIZATION ID>\
export CLOUDFLARE_EMAIL=<YOUR EMAIL>\
export CLOUDFLARE_TOKEN=<YOUR TOKEN>\
export CONFIG_PATH=<CONFIGURATION FILE PATH>
These variables are used to connect to Cloudflare at the correct organizationId and the relative credentials. If you want to deploy Heimdall on Kubernetes you should specify the management port in the configuration file in order to expose a handler to serve liveness and readiness probes.
Configuration file syntax (on Kubernetes):
{
  "collect_every_minutes": "5",
  "graphite_config": {
    "host": "graphite.company.com",
    "port": 2113
  },
  "kubernetes": {
    "management_port": "8888"
  }
}
Co-locations Metrics
Analytics by Co-locations provides a breakdown of analytics data by datacenter.
GET https://api.cloudflare.com/client/v4/zones/<ZONE_ID>/analytics/colos?since=-<COLLECT_EVERY_MINUTES>&until=-1ZONE_ID: is the unique id created by cloudflare during the zone set up
COLLECT_EVERY_MINUTES: is the number of minutes to collect for the zone
{
  ...
  "result": [
    {
      "colo_id": "SFO",
      "timeseries": [
        {
          "since": "2015-01-01T12:23:00Z",
          "until": "2015-01-02T12:23:00Z",
          "requests": {
            "all": 1234085328,
            "cached": 1234085328,
            "uncached": 13876154,

            ...,

            "http_status": {
              "200": 13496983,
              "301": 283,
              "400": 187936,
              "402": 1828,
              "404": 1293
            }
          },
          "bandwidth": {
            "all": 213867451,
            "cached": 113205063,
            "uncached": 113205063
          }
        }
      ]
    }
  ]
  ...
}
For each time-series present in the json response Heimdall creates a map with key equal to time-series (rounded on the minute) and as value, the data collected.
Requests (All, Cached, Uncached)
Breakdown of requests served
- All is the total number of requests served
- Cached is the total number of cached requests served
- Uncached is the total number of requests served from the origin
...
   counters, present := aggregate.Totals[timeSeries.Until]
   if !present {
     counters = model.NewCounters()
     aggregate.Totals[timeSeries.Until] = counters
   }

   counters.RequestAll.Value += timeSeries.Requests.All
   counters.RequestCached.Value += timeSeries.Requests.Cached
   counters.RequestUncached.Value += timeSeries.Requests.Uncached
...Bandwidth (All, Cached, Uncached)
Breakdown of totals for bandwidth in the form of bytes.
- All the total number of bytes
- Cached the number of bytes that were cached (and served) by Cloudflare
- Uncached the number of bytes that were fetched and served from the origin server
...
   counters.BandwidthAll.Value += timeSeries.Bandwidth.All
   counters.BandwidthCached.Value += timeSeries.Bandwidth.Cached
   counters.BandwidthUncached.Value += timeSeries.Bandwidth.Uncached
...HTTP status codes (1xx, 2xx, 3xx, 4xx, 5xx)
Key/value pairs where the key is a HTTP status code and the value is the number of requests served with that code group by http status code family.
- 1xx Informational: The request was received, continuing process
- 2xx Successful: The request was successfully received, understood, and accepted
- 3xx Redirection: Further action needs to be taken in order to complete the request
- 4xx Client Error: The request contains bad syntax or cannot be fulfilled
- 5xx Server Error: The server failed to fulfill an apparently valid request
...
   counters.HTTPStatus = totals(timeSeries.Requests.HTTPStatus, counters.HTTPStatus)

   ...

   func totals(source map[string]int, target map[string]model.Counter) map[string]model.Counter {
    for k, v := range source {
     value := target[getKey(k)]
     value.Value += v
     target[getKey(k)] = value
    }
    return target
   }

   func getKey(httpCode string) string {
    if strings.HasPrefix(httpCode, "2") {
     return "2xx"
    }
    if strings.HasPrefix(httpCode, "3") {
     return "3xx"
    }
    if strings.HasPrefix(httpCode, "4") {
     return "4xx"
    }
    if strings.HasPrefix(httpCode, "5") {
     return "5xx"
    }

    return "1xx"
   }

...Web Application Firewall (WAF) Metrics
WAF examines HTTP requests to your website.
It inspects both GET and POST requests and applies rules to help filter out illegitimate traffic from legitimate website visitors.
first call
GET https://api.cloudflare.com/client/v4/zones/<ZONE_ID>/firewall/events?per_page=50

next calls
GET https://api.cloudflare.com/client/v4/zones/<ZONE_ID>/firewall/events?per_page=50&next_page_id=<NEXT_PAGE_ID>
Firewall events endpoint provides us the logs about all the requests with a pagination of 50 items per page; Heimdall performs consecutive calls till the field occurred_at is inside the range of time under analysis or the cap of 150 recursive calls is reached (this limitation was mandatory to avoid exceeding the Cloudflare API rate limit).
The time range of analysis is calculated using the collect_every_minutes field in the configuration file.
eg. collect_every_minutes = 5, the time range is last 5 minutes.
{
    "result": [
        {
            ...
            "method": "GET",
            "host": "www.play.fr",
            ...
            "triggered_rule_ids": [
                "100043A"
            ],
            "action": "challenge",
            "occurred_at": "2019-01-29T13:25:57.09Z",
            "rule_detail": [
                {
                    "id": "",
                    "description": "REQUEST_HEADERS:HOST"
                }
            ],
            "rule_message": "False IE6 detection [Type B]",
            "type": "waf",
            "rule_id": "100043A"
        },
        {
            ...
            "method": "GET",
            "host": "www.play.fr",
            ...
            "triggered_rule_ids": [
                "100043A"
            ],
            "action": "challenge",
            "occurred_at": "2019-01-29T13:25:57.10Z",
            "rule_detail": [
                {
                    "id": "",
                    "description": "REQUEST_HEADERS:HOST"
                }
            ],
            "rule_message": "False IE6 detection [Type B]",
            "type": "waf",
            "rule_id": "100043A"
        }
    ],
     "result_info": {
         "next_page_id": "4xiXGZCKRvWXKWso9niNq3VW0I4e2eV8HUQ++0A="
     },
}
Heimdall groups data in minute (based on occurred_at field) and creates a map with key equal to occurred_at (rounded on the minute) and as value, the data collected.
  counters, exist := aggregate.Totals[occurredAt]
  if !exist {
   counters = model.NewCounters()
   aggregate.Totals[occurredAt] = counters
   }

  counter, present := counters.WafTrigger[trigger.Host]
  if !present {
   counter = model.NewWafTriggerResult()
   counters.WafTrigger[trigger.Host] = counter
   }

  if trigger.Action == "block" {
   counter.Block.Value++
  }
  if trigger.Action == "challenge" {
   counter.Challenge.Value++
  }
  if trigger.Action == "jschallenge" {
   counter.JSChallenge.Value++
  }
  if trigger.Action == "simulate" {
   counter.Simulate.Value++
}Rate Limits Metrics
Provides a full log of the mitigations performed by the Cloudflare Firewall features including
- Firewall Rules
- Rate Limiting
- Security Level
- Access Rules (IP, IP Range, ASN, and Country)
- WAF (Web Application Firewall)
- User Agent Blocking
- Zone Lockdown
- Advanced DDoS Protection
first call
GET https://api.cloudflare.com/client/v4/zones/<ZONE_ID>/security/events?limit=1000&source=rateLimit&since=<SINCE_DATE>&until=<UNTIL_DATE>

next calls
GET https://api.cloudflare.com/client/v4/zones/<ZONE_ID>/security/events?limit=1000&source=rateLimit&cursor=<NEXT_PAGE_ID>
Security events endpoint provide us the logs about all the mitigations performed 1000 items per page, Heimdall performs recursive calls till the field “occurred_at” is inside the range of time under analysis.
{
    "result": [
        {
            ...
            "source": "rateLimit",
            "action": "simulate",
            "rule_id": "89bde9c3a3e8474aa0fb4e079956f7be",
            "host": "secure.play.at",
            "method": "GET",
            "matches": [
                {
                    "rule_id": "89bde9c3a3e8474aa0fb4e079956f7be",
                    "source": "rateLimit",
                    "action": "simulate",
                    "metadata": {
                        "ruleSrc": "user"
                    }
                }
            ],
            "occurred_at": "2019-01-17T13:22:23Z"
        },
        {
            ...
            "source": "rateLimit",
            "action": "simulate",
            "rule_id": "89bde9c3a3e8474aa0fb4e079956f7be",
            "host": "secure.play.at",
            "method": "POST",
            "matches": [
                {
                    "rule_id": "89bde9c3a3e8474aa0fb4e079956f7be",
                    "source": "rateLimit",
                    "action": "simulate",
                    "metadata": {
                        "ruleSrc": "user"
                    }
                }
            ],
            "occurred_at": "2019-01-17T13:22:25Z"
        }
    ],
    "result_info": {
        "cursors": {
            "after": "nxwwlE6hlpC8sK4eE6gYa8ZiLnrG39YfOu2UE2uUfy-oG6-NGH9F_-gA2ccKxdG_HcidNo17MlLIaCXjH40",
            "before": "BYkrZkEeaoHwzAifWXzfDf4Ec4weTpeMXnbjPnh2VPWhH73ec6Sqm5kzdb37R-_oiNlrhxED4QWN-tALq2Ig"
        },
    },
}
In this case Heimdall group data in minute (based on occurred_at field) and divide data by http method and host, for each key pair save the counters
  counters, exist := aggregate.Totals[occurredAt]
    if !exist {
     counters = model.NewCounters()
     aggregate.Totals[occurredAt] = counters
    }

  counter, present := counters.RateLimit[rateLimit.Host]
  if !present {
   counter = model.NewRateLimitResult()
   counters.RateLimit[rateLimit.Host] = counter
  }

  rateLimitCounters, _present := counter[rateLimit.Method]

  if !_present {
  rateLimitCounters = model.NewSecurityEventCounters(strings.ToLower(rateLimit.Method))
   counter[rateLimit.Method] = rateLimitCounters
  }

  if rateLimit.Action == "drop" {
   rateLimitCounters.Drop.Value++
  }
  if rateLimit.Action == "simulate" {
   rateLimitCounters.Simulate.Value++
  }
  if rateLimit.Action == "challenge" {
   rateLimitCounters.Challenge.Value++
  }
  if rateLimit.Action == "jschallenge" {
   rateLimitCounters.JSChallenge.Value++
  }
  if rateLimit.Action == "connectionClose" {
   rateLimitCounters.ConnectionClose.Value++
  }
Conclusions
In this article we saw the features of Heimdall, how to configure it and run it in Kubernetes or in a traditional environment, we saw all the data that can be collected and the charts that can be made with it.
We explained how Heimdall gathers data, from which Cloudflare’s endpoints and how Heimdall groups the data and creates metrics to push to Graphite.
That’s all folks, try Heimdall and contribute to the growth of this project. Comment below if you have any questions or doubts on how to use it or why we developed it!
How to contribute
Heimdall is now open source under the Apache 2 License; clone it, fork it and hack it at your will!
Did you find a bug?
- Ensure the bug was not already reported by searching on GitHub issues.
- If you’re unable to find an open issue addressing the problem, open a new one. Be sure to include a title and clear description, as much relevant information as possible, and a code sample or an executable test case demonstrating the expected behavior that is not occurring.
Did you write a patch that fixes a bug?
- Open a new GitHub pull request with the patch.
- Ensure the PR description clearly describes the problem and solution; reference the issue number if applicable.
Do you intend to add a new feature or change an existing one?
- Suggest your change opening an issue.
Do you have questions about the source code?
- Ask any question about how to use Heimdall on Heimdall board.

