
Technology
Observability as a Product of the Software Factory


A feature isn't really ready to ship until it is observable. How we turned dashboards and alerts into code that coding agents can write under the same checks as the rest of our software, and why the metrics registry this produces as a side effect matters as much as the dashboards themselves.
The missing piece of the factory
When we talk about a software factory, we mean something specific: the infrastructure that takes a clear business requirement and turns it into a feature that is implemented and ready to ship. Along the way, AI agents, tools, pipelines and people all play a part, with levels of automation that vary with the risk involved and human gates wherever a decision needs to be made.
The definitions going around today almost always stop at “shipped”. But a feature isn’t really ready if, once it is in production, we can’t tell whether it works. We need metrics, dashboards and alerts to tell us. And today, in most organisations, that part lives outside the flow in which agents work well: it is built by hand, in a graphical interface, after the release.
Hence the question behind this post: how do we make observability a product of the factory, something the same agents can generate, subject to the same checks as the code? Our answer is called observe-o-matic.

The context: a problem of scale
As the number of services and teams grows, keeping dashboards and alerts consistent becomes a cost that grows with the scale. Every team builds its own views, with its own conventions, and the good work done by one team doesn’t automatically carry over to the others.
We had already tackled part of the problem. Our internal application framework standardises the base metrics that every service exposes: HTTP traffic, latencies, JVM resources. Application metrics, the ones that tell the story of a service’s domain (orders, payments, searches), remain specific to each team. On top of that, the link that turns both kinds into dashboards and alerts was missing.
There was also a less visible aspect: the meaning of application metrics. What exactly a counter measures, what its tags mean, which values they can take: this information is spread across the code of individual services and the experience of the teams that created them.
Four ways to give Grafana to an agent
If we want a coding agent to take care of observability, the first choice to make is which interface to give it. There are four realistic options.
| The agent… | Strengths | Limits, from an agent’s point of view |
|---|---|---|
| works directly on Grafana (API or MCP server) |
immediate, great for exploration and debugging |
imperative changes, no review, no reproducibility, wide blast radius |
| writes dashboard JSON | no dependencies | huge, untyped files, easy to invent fields, unreadable diffs |
| uses a generic as-code approach (Grafana’s Terraform provider, Grafonnet, Grafana Foundation SDK) |
reproducible, reviewable | the abstraction is Grafana’s own: PromQL and conventions are still up to the agent, errors surface at runtime |
| uses a domain-specific language (observe-o-matic) |
narrow interface, built-in knowledge, compile-time errors, tailored to and integrated with the company’s infrastructure |
has to be built and maintained; covers the cases it was designed for |
Each of the first three options has a legitimate place. An MCP server for Grafana, for instance, is valuable for reading: exploring the available metrics or investigating an incident. But none of the three is designed to own the state of observability inside an automated flow, and all of them produce a single thing: dashboards.
A domain-specific language produces something else too. To use a metric, you first have to declare it, with its type, its tags and what they mean. As a side effect, a metrics registry is born. We’ll come back to this point, because it is what makes observe-o-matic a piece of the factory rather than an isolated tool.
From prompt to dashboard
observe-o-matic is a TypeScript library. Dashboards are described as code, with a domain vocabulary (metrics, panels, alerts) instead of Grafana’s data model. A dedicated repository for each area contains the definitions and a pipeline that publishes them.
Let’s walk through the flow with an example service. The developer asks the agent:
“Create a ‘Checkout’ dashboard with the request rate by status, the average latency by URI and the percentage of 5xx errors. Add a critical alert if errors exceed 5% for five minutes.”
The agent starts from the metrics, analysing the application codebase. Once it has identified them, it declares them with their type and tags:
export const checkoutRequests = counterMetric("checkout_requests_total", {
  tags: { app: "logical application name", status: "HTTP status code" },
});
export const checkoutLatency = timerMetric("checkout_latency_seconds", {
  tags: { app: "logical application name", uri: "request URI template" },
});
Then it composes the dashboard from the library’s panel templates:
export const checkoutDashboard = dashboard(
  "Checkout",
  [aggregationTime()],
  [
    row(
      rateLine({
        title: "checkout: request rate",
        metric: checkoutRequests,
        aggregateBy: ["status"],
        unit: "ops",
      }),
      timerAvgLine({
        title: "checkout: avg latency",
        metric: checkoutLatency,
        aggregateBy: ["uri"],
        unit: "s",
      }),
    ),
    row(
      ratioStat({
        id: "checkout-5xx-ratio",
        title: "checkout: 5xx ratio",
        numerator: checkoutRequests,
        numeratorFilters: { status: /5.*/ },
        denominator: checkoutRequests,
      }),
    ),
  ],
);
Finally, it attaches the alert to the panel:
export const alerts = [
  alert(checkoutDashboard.panels["checkout-5xx-ratio"], {
    name: "critical",
    condition: gt(0.05),
    for: "5m",
    labels: { team: "checkout", severity: "critical" },
  }),
];
The alert has no query of its own: it derives it from the panel’s query. What we see on the dashboard and what wakes us up at night are, by construction, the same number.
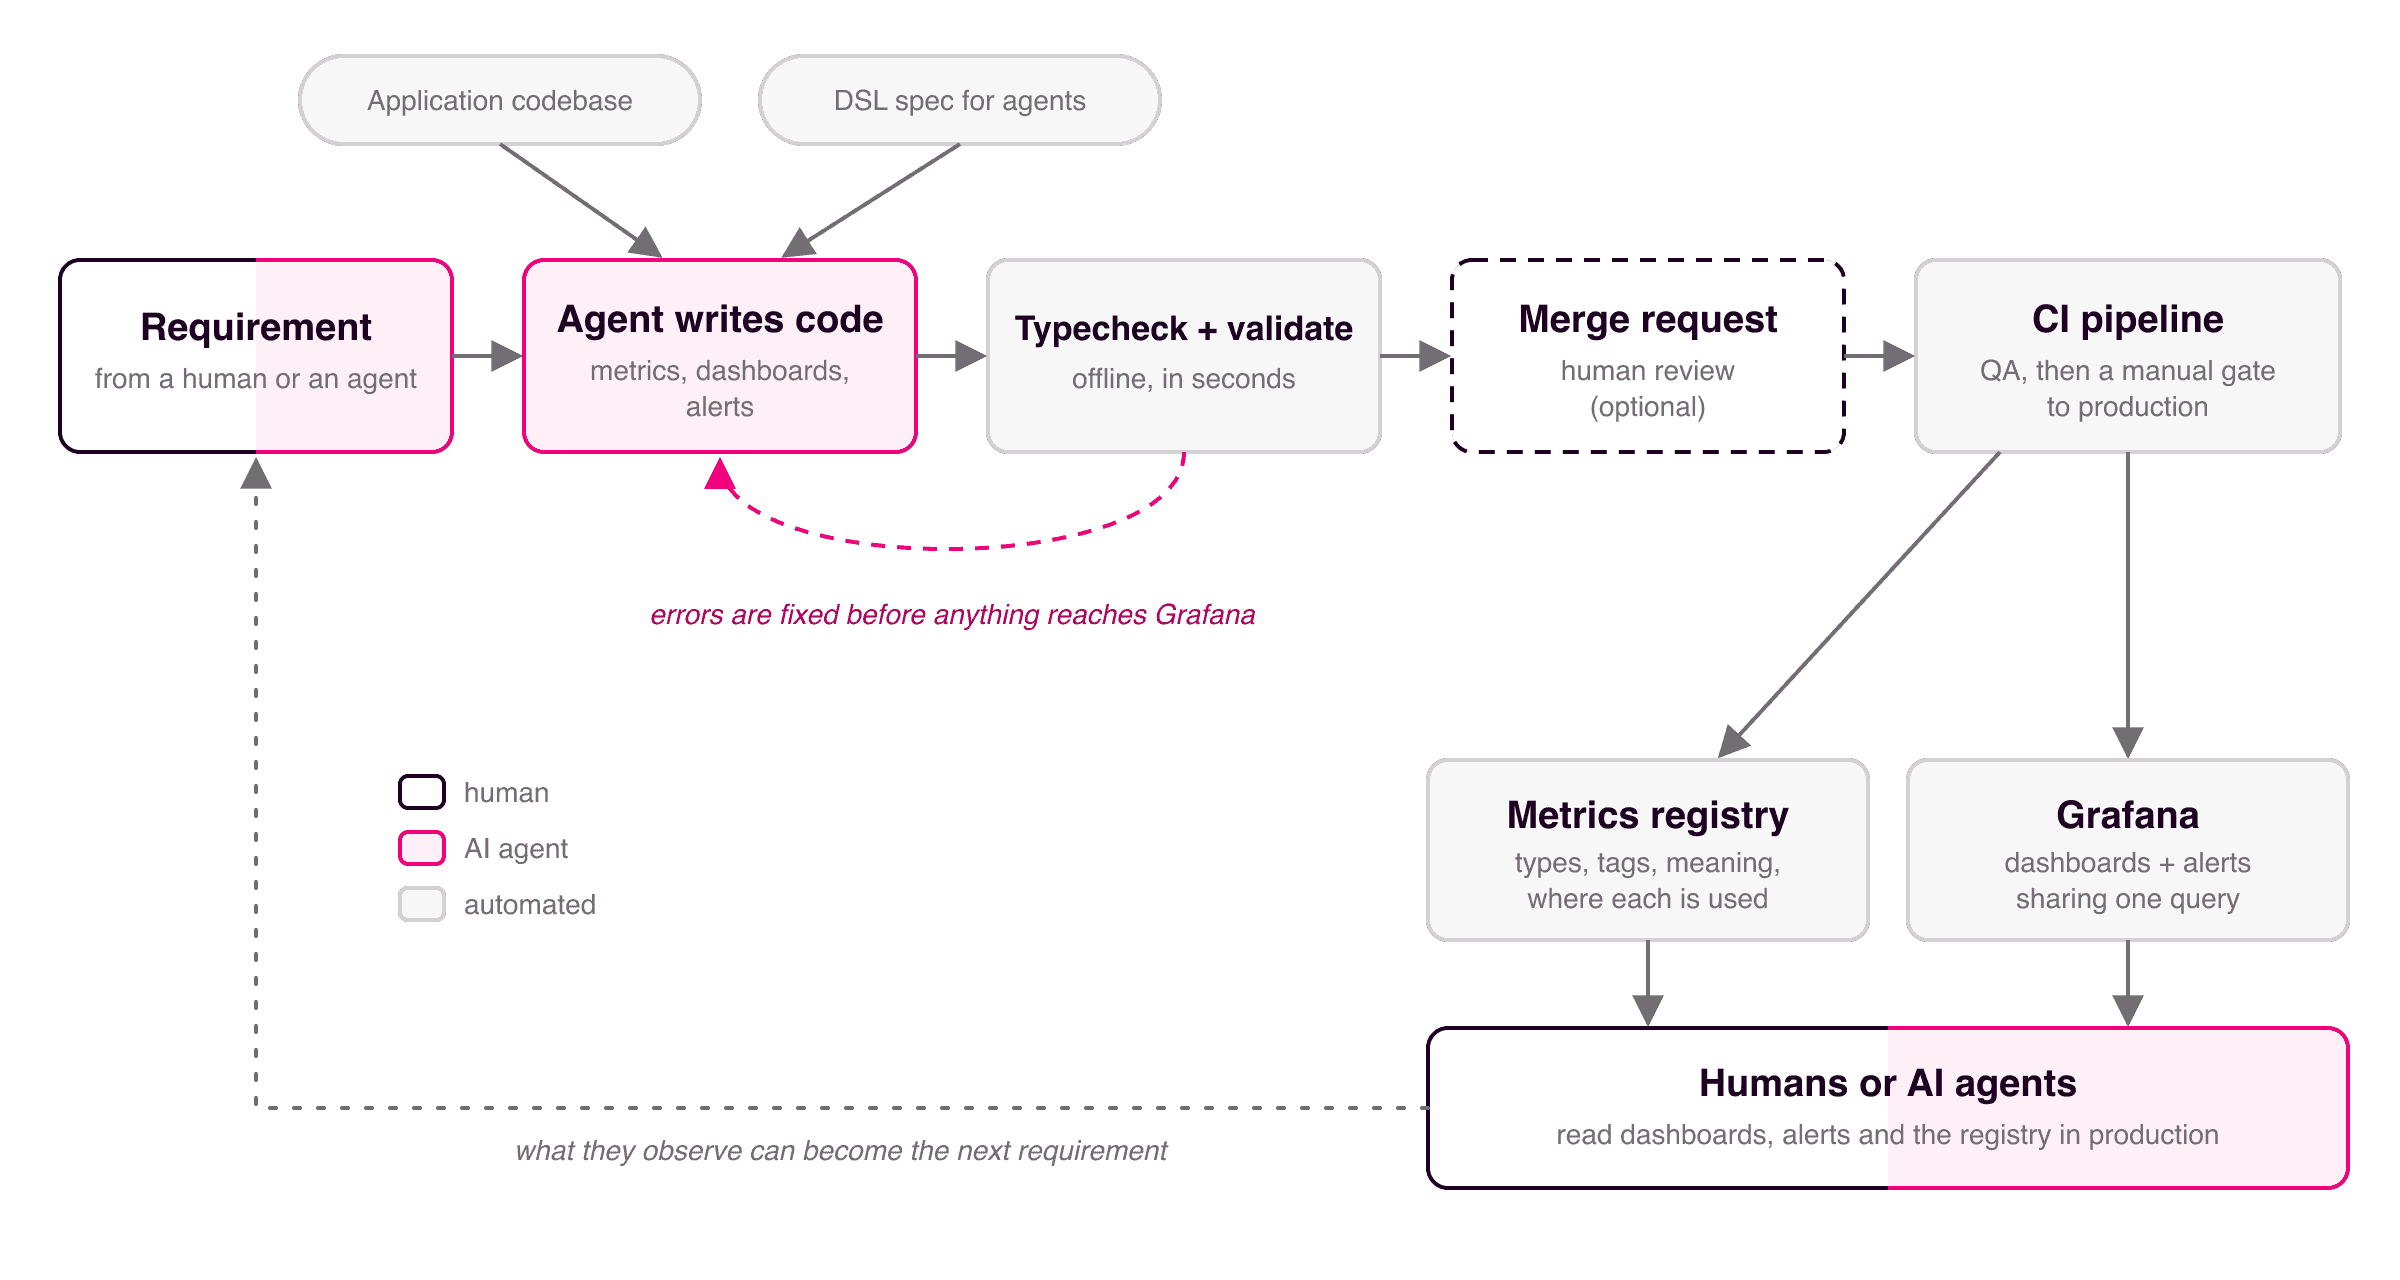
Here is the whole workflow, from the requirement to production, and how it can feed the next requirement:
Why an agent works well this way
Feedback comes immediately. If the agent uses a tag the metric doesn’t declare, or passes a timer to a template that expects a counter, the code doesn’t compile. A second command, validate, checks offline what the compiler can’t see: duplicate titles, ambiguous alerts. The agent writes, gets the error and fixes it, all before anything reaches Grafana. The full specification of the language ships inside the package, in a file designed to be read by agents, so the documentation the agent consults always matches the installed version.
Knowledge is written once. Take the average latency panel from the example. The intuitive approach is to compute the average latency of each instance of the service and then average those. But that way an instance that served 10 requests weighs as much as one that served 10,000, and the resulting number doesn’t match what users actually experience. The correct calculation sums the total time and the total number of requests across all instances, and only divides them at the end. It isn’t hard, but it is easy to get wrong, and the mistake is invisible: the chart looks plausible. The timerAvgLine template contains the right formula, and whoever uses it, person or agent, doesn’t have to remember it.
Guardrails are part of the design. When a definition is removed from the code, the pipeline can delete the corresponding dashboard, but only if it created it (every published object carries an ownership marker), only after saving a restorable backup, and never beyond a maximum number of deletions per run. Anything created by hand is never touched. Changes can go through a merge request for review, and the production release always requires a person’s approval.
The metrics registry: what it makes possible
Having to declare every metric with its tags and their meaning looks like a cost at first glance. In reality, it produces a versioned metrics registry, aligned by construction with what dashboards and alerts use in production. The value of this registry lies above all in what it enables.
Standardisation becomes a concrete process. Once metrics are catalogued, they can be compared across teams, names and tags can converge, and the ones that work best can be recognised and promoted to the shared catalogues. The framework’s base metrics, for example, are already available as a ready-to-use catalogue. Convergence is steered with data, instead of being imposed from above.
Knowledge is shared. Anyone who needs to build a new view, or simply understand a service they don’t know, can find out what is already measured and what it means. Every repository generates a browsable catalogue of metrics and alerts, with an index of where each metric is used.
DevOps agents have context. An agent investigating unusual behaviour in production needs to know which metrics exist, what their tags represent and which values they can take. With a registry, it can query the system knowing what it is looking at, instead of inferring meaning from names.
A piece of the software factory
Current definitions of a software factory identify three recurring capabilities: coordinating the work, giving agents the environment and knowledge they need, and verifying what they produce. observe-o-matic contributes to the last two. It provides knowledge (the language, the specification for agents, the registry) and verification (the compiler, the validation, the release gates).
This lets us extend the meaning of “ready to ship”. The agent that implements a feature can declare, in the same flow and the same merge request, the metrics, dashboards and alerts that make it observable, subject to the same checks as the code. And the requirement becomes verifiable: if it asks to reduce checkout abandonment, the measure of that reduction is code as well. The chain from requirement to feature to metric to alert is traceable.
Above all, the loop closes. Definitions of the software factory stop at the release, while the registry and the alerts are exactly what DevOps agents read in production. What they observe (an anomaly, a bottleneck, a feature nobody uses) can become the next requirement entering the factory. observe-o-matic fills the space between shipping a feature and understanding how it behaves.
What we learned
Agents do their best work within tight constraints. A small, typed interface with immediate feedback is worth more than a powerful one. In a factory, designing the interfaces between the pieces matters more than writing the code inside each of them.
Documentation for agents must be treated as code. It has to be versioned, shipped with the library and updated in the same change that alters the behaviour. The same goes for the metrics registry, which lives next to the definitions and therefore cannot drift away from them.
In three months, observe-o-matic has been adopted by five areas, which now use it to manage more than 30 dashboards, 600 panels and 140 alerts across around fifteen services. Most of the changes to these repositories were written by or together with a coding agent. And the registry already counts nearly a thousand metrics, each with its own description: in one case, an area catalogued more than 800 of them before building a single dashboard.
The next steps go in the direction of more automation: making the registry directly queryable by DevOps agents, and letting alerts drive those agents through troubleshooting sessions. We are also going to try the very same approach on business KPIs, generating their dashboards and alerts in the same way.
Read next


From Months to Weeks: The Smart Way to Let AI Do a Migration


How we migrated 137 modules to a new dependency-injection pattern with AI, turning a quarter-long slog into a few focused weeks by teaching the AI instead of delegating to it, working in small supervised steps, and letting the method compound. [...]


Written by lastminute.com folks, who live for the holidays. You should follow us on Twitter.


Want to express your love for travel and tech? Well, you could read another article, or you could just come and join us. We’re always looking for talent to help us enrich the lives of travellers - find your role here.
The postings on this site are authors' opinions and experiences and do not necessarily represent the postings, strategies or opinions of lastminute.com group.