
Technology
Performance Testing Tools: Gatling vs Jmeter


When it comes to performance testing, which one should you pick between Jmeter and Gatling? And Why?
In our experience, we noticed that performance testing is often overlooked, especially if compared to other testing activities with a different scope (unit, integration, e2e). However, performance testing is critical to meet the performance standards required by business partners as well as dealing with seasonal or event affected traffic. Then, choosing the right tool is a key step.
Performance Testing Matters
Performance testing is widely acknowledged as an important part of the Software Development Life Cycle. Having a responsive application that delivers the expected outcome, without irritating its users, independently from the traffic it is receiving, is not any longer a nice to have feature, but it is more of a must. Applications that do not meet performance expectations quickly lose users, and consequently money to the companies that build them.
Lack of performance can yield an increase in infrastructural costs, reputational damage, and, in the end, decreased return on investment.

Performance testing is a way to prevent the latter scenario, by providing information to the stakeholders on the application’s responsiveness, stability, and scalability under different traffic loads, before it is released to the market. It is a way to shed some light on what is going on under the hood. Ignoring the performance dimension can endanger your business. Here is the recap of some lessons we learned during our performance testing activities targeting several services. These lessons were learned during the journey the Skynet Team started more than one year ago when we decided to invest more and more in performance testing as a way to deliver a higher value for our customers. Particularly, here we are focusing on questions that might arise at the beginning of any performance testing activity. Which of the two approaches (let’s call the code-oriented vs tool-oriented) to pick? How to make the right decision to preserve long-run test maintainability?
How we started with Jmeter
When we had to select a proper tool for performance testing on our team, among many others, Jmeter caught our attention because of the following reasons:
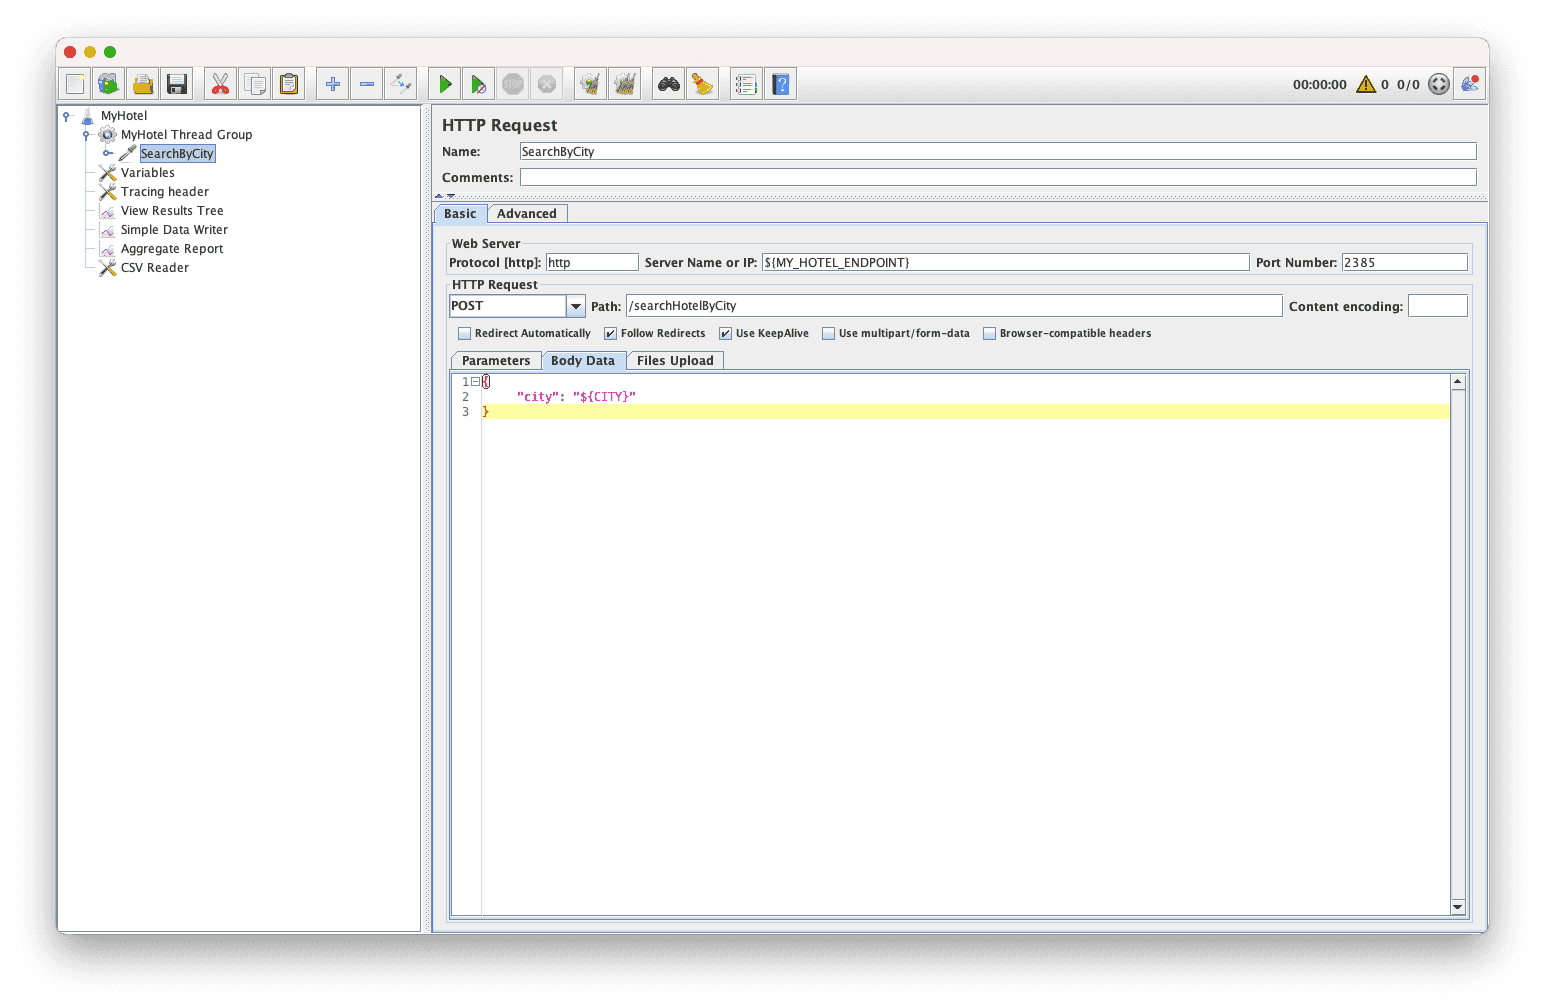
- It is basically a GUI-based tool. As a matter of fact, a JMeter test case is a custom
XML(JMX) file, that can be configured through a GUI. This makes the learning curve, in the first place, relatively less steep than other code-oriented approaches. - The official website presents thorough documentation. Also, being a well established long-run project, there is a lot of information and workarounds, coming from the wide user community.
- Jmeter is extendable using plugins addressing different needs.
- Last but not least, there was some background knowledge of this tool in the company. We thought that this would have facilitated the communication and the knowledge transfer. We consider this a plus.
For sure not all that glitters is gold and there are some drawbacks. Notoriously, running Jmeter scripts can be demanding in terms of performance. In any case, it is recommended to run the Jmeter script in headless mode, without lack of irony, to prevent performance issues on the performance testing suite side.
We started using a JMX file as a template. In this template, we defined several test steps (that we called
phases) that everyone could modify and even extend.
A few of the challenges we faced
After working more than one year in designing, implementing and releasing solutions for automating performance testing we concluded that using JMeter falls short in many respects.
- Too many scripts: It is easy to end up with multiple scripts targeting the same service, for different purposes. We are not talking only cross-project, but inside the same project, we had multiple scripts, addressing different scenarios, such as in the case you need to run a load test, stress test, with different traffic profiles.
- Code duplication: Whenever you fix a bug in one script, you have to fix it repeatedly in all similar scripts. This is an error-prone condition.
- Parameterization: From time to time, Jmeter scripts suffered when we had to work with a number of parameters. This happened usually when we had to make the test execution the most flexible possible. A case in point is when you need to change some parameters (such as the number of users, etc.) in your traffic profile (flat, ramp-up, etc.). The parameters’ value are assigned at run time, starting from, for example, the value of a variable instantiated in the CI/CD environment.
- Code reuse: because there is no easy way to implement, for example, code modularization with JMeter. This is basically due to its configuration-oriented nature (as we wrote above, the JMeter script is based on XML files that hold the instructions in a declarative way). And even if there is a way to attach code on Jmeter, it is that hard that in the end, we have to resort to external scripts to generate all the data needed for the test. On the other hand, with an Software Development Engineer in Test outlook, it makes a lot of sense to reuse/replicate an effective testing scenario, wherever possible, without re-inventing the wheel over and over again.
Generally speaking, JMeter lacks a proper embedded coding environment. Even if we cannot expect the precision of an IDE, it must be said that JMeter’s coding capabilities do not allow a full-fledged coding experience (the one you can get with the most popular IDEs), but can, at times, fall short when it comes to debugging your code.
How we ended up with Gatling
We thought that these issues could be addressed by relying on code instead of configuration.
Firstly, we had to decide which code-based library we wanted to give a try. We went for Gatling, as it is written in Scala, and much of our existing codebase was relying on languages run by the JVM, so we can reuse most of it.
With all the challenges that we noticed in the previous section, we started to address them by creating a new base project which included all the common functionalities that were causing troubles with Jmeter. These are:
- Load profiles: we defined a series of load profiles that were the most common (constant load, increasing load, spiky).
- HTTP Client configuration: usually it’s a good practice to mark your performance test traffic in an easily identifiable way. We provided a default way to do it.
- Environment management: a way to give a symbolic name to an environment endpoint
- External configuration: a way to configure the previous modules (which load profile is being used on the test, the HTTP client configuration and the environment to be tested) using a JSON. In this way, everything could be configurable from the outside except defining the endpoint and the REST operation.
Which solved:
- Duplication removal: Having a lot of similar scripts, but with slight variations was a real pain. So, extracting this code to a base project and just configure them on the simulation (or even on the runtime) saved a lot of effort.
- Maintainability: changing our mind on modifying some load profile, adding new tracing headers to the HTTP client configuration or adding a new feature doesn’t require us to do this procedure manually on every script: we only require to modify the base project and update the dependency accordingly.
- Standardization: constant, laddered, spiky load profiles… What does it mean to us? Sometimes it’s hard to reach a common agreement on what’s what, and where are the boundaries between them. And as words fly away, but code remains, it’s easier to have a common domain if the agreement is defined precisely by code.
- Parameterization: we created a set of parameters that made sense to us. It means that parameters are not defined by technical constraints, but they have semantic meaning.
Our way of doing things
This is a how a simulation looks like using the base project we created:
class MyHotelSimulation extends GatlingTemplateFromJson {
  override def testedApplication = HotelApp
  override def createScenario = scenario("Search Hotels")
    .feed(getFeeder)
    .exec(http("Search hotels by city")
      .post("/searchHotelByCity")
      .body(StringBody(
        """{
          |	"city": "${CITY}"
          |}""".stripMargin)).asJson.check(bodyString.transform(_.length).gt(10)))

  private def getFeeder = {
    val createSynthethicSearchApi = new CreateSynthethicSearchApi
    createSynthethicSearchApi.get(10000, SearchType.HOTEL).asScala.map(it => it.asScala.toMap[String, String]).toIndexedSeq.circular
  }
}- As you can see, the simulation is extending from GatlingTemplateFromJson. which means that the load profile, environment and HTTP client is managed by the base project itself.
- testedApplication: a map that links the environment name with the URL
- createScenario: a Gatling scenario, which defines the REST operation under test
The point is that writing a performance test became much easier. You only need to define a Gatling scenario and a list of environments, everything else is managed by the GatlingTemplateFromJson class.
So, in order to configure these elements at runtime, the test is executed, and accepting this JSON as a parameter:
{
  "env": "qa",
  "tracing": "hotel-stress-test",
  "loadProfile": "simple",
  "loadProfileContent": {
    "duration": 300,
    "users": 3
  }
}
So, without changing any code, we can configure the environment, the HTTP client configuration, and the load profile.
Conclusion
No tool is better than another. A code-based tool like Gatling allows you to simplify many things, and to make it fit your needs, but it requires a deeper knowledge in order to work with it. Jmeter instead is an easier, popular and intuitive alternative, but its low maintainability makes it arduous to work with it for complex scenarios.
Concluding, Gatling is more flexible, so it allows you to work more efficiently on complex scenarios, and to maintain multiple test suites easily. On the other hand, Jmeter is more suited for projects with a narrower scope. Its GUI makes it useful for quick solutions.
Read next


Beyond Compliance: How We Built a Phishing-Aware Culture Across 1,700 Employees


Compliance checkboxes don't change behaviour. Here's how we used RIOT's AI-powered platform to run real phishing simulations, deliver contextual micro-training via Slack, and cut our vulnerability index by more than half across 1,700 employees. [...]


Written by lastminute.com folks, who live for the holidays. You should follow us on Twitter.

Want to express your love for travel and tech? Well, you could read another article, or you could just come and join us. We’re always looking for talent to help us enrich the lives of travellers - find your role here.
The postings on this site are authors' opinions and experiences and do not necessarily represent the postings, strategies or opinions of lastminute.com group.