At lastminute.com we love data; we like to measure everything and get feedback from data to drive our next actions and improve continuously. In the Platform team we take care of the Continuous Integration and Continuous Delivery systems (CI/CD) that enable our product teams to ship features to our users with confidence; when talking about collecting data from these systems the challenge is extracting the right data points to be able to measure KPIs in terms of software delivery; usually the off-the-shelf software that we use does not provide enough data to allow such reasoning.
Jenkins metrics
A part of our CI uses Jenkins to perform artifact builds; Jenkins has been adopted also as part of our Continuous Delivery system to orchestrate the deployments on Kubernetes. We have been pioneering the use of Kubernetes since early 2015 and at that time there was no Helm or Kustomize, so we built our own deployment tool and Jenkins was the obvious way to orchestrate deployments across multiple environments. The code that performs this orchestration is based on Jenkins scripted pipelines so it’s written in the Groovy programming language, interoperable with Java. When we started measuring our Jenkins we only had the standard infrastructure metrics (cpu, network, disk access, etc…) that are read by collectd standard plugins; this was not enough to have a decent feedback on the interactions between all the part of our CI/CD systems along the deployment pipeline. We found ourselves in need of gathering more data:
- how many deployments were we shipping every minute?
- how long did it take to deploy a canary to a staging environment compared to production?
- how much time of the pipeline was spent on processing and how much on waiting for network transfers?
While most of this data may be accessible through the Jenkins API, in a complex system with hundreds of microservices deployed multiple times a day, it was very difficult to normalize the textual representation of this data (Jenkins has a JSON/REST API) into time-series data for visual analysis. Looking for a way of extending the surface of monitoring for our pipelines with Jenkins we found an interesting plugin called Metrics: it is an implementation of Dropwizard metrics to expose application metrics to the outside world; by installing the plugin you get JMX beans and a web UI to explore the standard metrics collected. In the standard metrics you can find the number of builds executed by each agent, the build queue length and times and the status of Jenkins jobs; this data are very handy and they can give a good representation of the status of what Jenkins is doing.
Standard metrics collection
To enable the JMX to be scraped by collectd we added an option to the Jenkins configurations using a variable JENKINS_JMX_OPTIONS and added the new variable to the standard options variable
JENKINS_JMX_OPTIONS="-Dcom.sun.management.jmxremote=true -Dcom.sun.management.jmxremote.rmi.port=4001 -Dcom.sun.management.jmxremote.port=4001 -Dcom.sun.management.jmxremote.local.only=false -Dcom.sun.management.jmxremote.authenticate=false -Dcom.sun.management.jmxremote.ssl=false  -Djava.rmi.server.hostname=<PRIVATE_IP>"

## Type: string
## Default:     "-Djava.awt.headless=true"
## ServiceRestart: jenkins
#
# Options to pass to java when running Jenkins.
#
JENKINS_JAVA_OPTIONS="... $JENKINS_JMX_OPTIONS"
This is needed to allow the JMX connection to happen from collectd to the JVM instance running Jenkins.
We configured collectd to read the Dropwizard beans using the GenericJMX plugin, with a file called jmx-jenkins.conf, here’s an excerpt of it with the relevant configuration.
LoadPlugin java
   <Plugin "java">
	   JVMArg "-verbose:jni"
     JVMArg "-Djava.class.path=/opt/collectd/share/collectd/java/collectd-api.jar:/opt/collectd/share/collectd/java/generic-jmx.jar"
     LoadPlugin "org.collectd.java.GenericJMX"

     <Plugin "GenericJMX">
        <MBean "ci-metrics">
           ObjectName "metrics:name=jenkins.*"
           InstancePrefix ""
           InstanceFrom "name"
           <Value>
             Type "requests"
             InstancePrefix "Count"
             Table false
             Attribute "Count"
           </Value>
           ...
         </MBean>

         <Connection>
           ServiceURL "service:jmx:rmi:///jndi/rmi://localhost:4001/jmxrmi"
           Collect "ci-metrics"
           InstancePrefix "cicd-"
         </Connection>

     </Plugin>
   </Plugin>
The name of the bean is specified in the ObjectName parameter; the beans exposed by default are: jenkins.*,http.* and vm.* which respectively represent the Jenkins job metrics (build queue, agents), the Jetty HTTP server metrics (number of requests, status codes) and the JVM metrics (heap, threads, gc). We are not very interested in the HTTP stats of the web server so we chose only to collect the jenkins and vm beans.
Once collectd was reloaded with a systemctl reload collectd we started getting our data in and we built some interesting visualization of our system: for instance we were able to correlate Jenkins master instance load with the number of queued jobs and scale our agents accordingly.
We leverage Jenkins distributed builds but we would never know how many executors we need without this data.
Custom metrics
After the first successful iteration we decided to investigate what we could do to get even more data and if it was possible to create our own custom metrics out of the Dropwizard API implemented in the plugin.
Full credit goes to a former colleague (the one and only Mauro Ferratello) for finding the way to inject custom metrics into the JMX beans exposed by the plugin; with a couple of hours digging into the source code and some thread dumps he was able to discover a MetricsRegistry object, a publicly visible registry of all the metrics exposed.
Starting from there we found a way of creating custom beans by simply adding a common prefix to the new metrics, we chose pipelines to discern from the already existing beans.
import com.codahale.metrics.MetricRegistry

class MetricsFactory implements Serializable
{
  public static final String COLLECTD_BEAN_NAME = "pipelines"
  private final Object metricsClazz
  private baseMetricPath

  MetricsFactory(metricsClazz, String nodeName, String appName){
    this.metricsClazz = metricsClazz
    this.baseMetricPath =  MetricRegistry.name(COLLECTD_BEAN_NAME, aggregateDynamicNodes(nodeName), appName)
  }
}
Then we created a Timer class to represent a nanoseconds-resolution timer to record spans of time under a custom metric name; using the Dropwizard Clock object is mandatory to record properly the elapsed time in a format that is understandable by the metrics collector.
import com.codahale.metrics.Clock
import java.util.concurrent.TimeUnit

class Timer implements Serializable
{
  private long startTime
  String name
  private final Object metricsClazz

  Timer(metricsClazz, String name)
  {
    this.metricsClazz = metricsClazz
    this.name = name
    this.startTime = Clock.defaultClock().getTick()
  }

  @NonCPS
  void stop()
  {
    def thisTimer = metricsClazz.metricRegistry().timer(name)
    thisTimer.update(Clock.defaultClock().getTick() - startTime, TimeUnit.NANOSECONDS)
  }
}
We added the call to MetricsFactory in our pipelines and when we verified that the new metrics were there, by connecting to the JMX and checking the new beans, we knew we had found the holy grail!
The complete configuration file now tells collectd to fetch also the custom bean pipelines and all the metrics below it: we are now able to measure every single step in our pipelines execution by adding a timer where we need it.
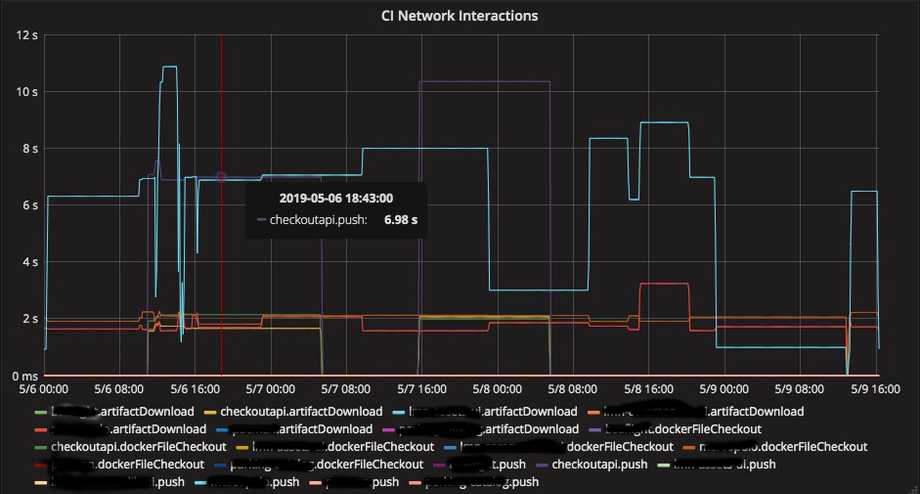
For example one of the first thing we wanted to measure was how much time of the pipeline was spent waiting for other components (artifact repository, Docker registry, Kubernetes controllers) and network transfers between them, so that we could optimize our network and deployment process.
An example pipeline shows how we are now collecting multiple timers for every step along the flow, and below an example of visualization that we can get from these metrics.
This graph represents for each microservice the time spent in network transfers between different components of the CI system, it is very valuable for us to understand what operations are network-bound; in the selected metric in light blue we see a Docker image push time with high deviation, so we know we should keep an eye on the artifact size: maybe the team is adding/removing dependencies?
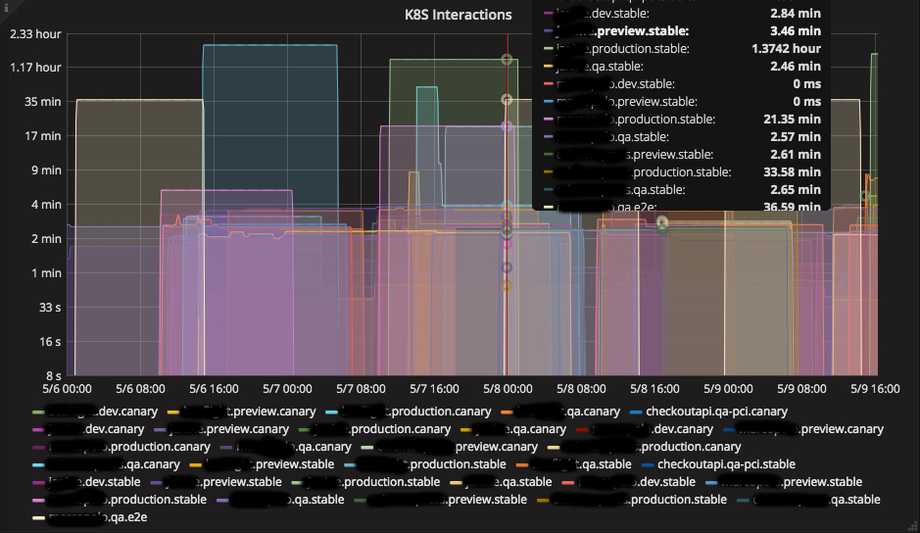
In this graph we record for each microservice the time spent to rollout canary and stable deployments after we have sent the Kubernetes API the Deployment request; we want to know if some microservices have slower rollout times so we can tune the maxSurge and maxUnavailable deployment parameters to have a faster rollout.

Wrapping up
It is useful to analyze data from the CI/CD environment: it enables product teams to get powerful insights into how their software is built and delivered along the pipeline, and the infrastructure teams can optimize around the data to allow faster and faster iterations. We presented here just a few examples of the awesome data we have at our disposal with the metrics we are now collecting from our pipelines; we hope this small piece of code can help improve your CI/CD as well!
Credit
Mauro Ferratello is a Jenkins expert, an Agile mentor and a solid engineer; part of the amazing CI/CD platform we run was architected and implemented by him and we owe him a lot for the work he’ve done at lastminute.com. This post represents just a very little of the tremendous impact he had on the company with his contributions, so: thank you Mauro ❤️.


