Data Environment for Big Data and warehouse
lastminute.com wants to be a fully data-driven, digital company, where data is the first source for decision making, and for that, the data stack has to be a first in class one!
Our data ecosystem covers:
- Datawarehouse and Business reporting
- Advanced analytics and Artificial Intelligence (covered in the next paragraph)
- Operative Reporting and operational pipelines Leaving aside production systems architecture, any AI services, or business users data pipelines, let’s explore our Data Architecture from a logical point of view first, and then from a technological perspective.
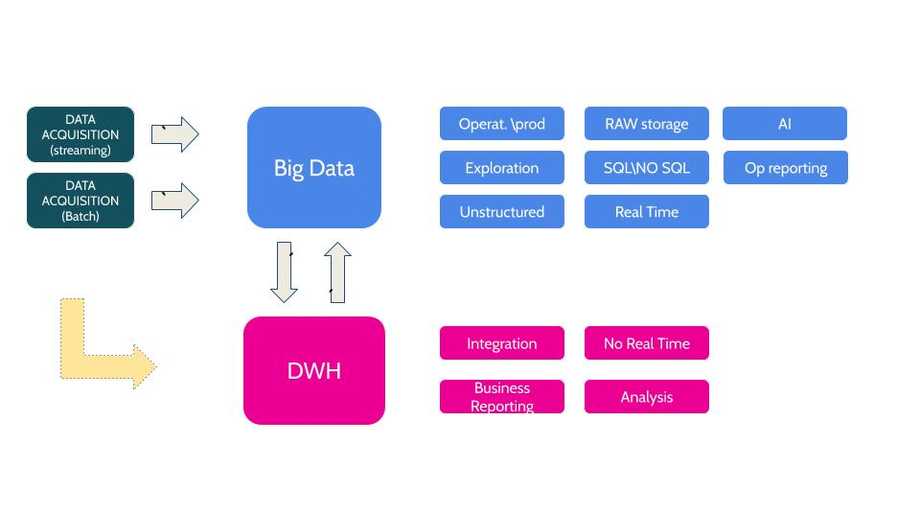
The Logical Data Architecture can be summarized as follows:
There are three main data sources (website operational databases, real-time events, and external sources such as partner platforms). While DWH is used for Business Reporting and Analytics at day-1 or earlier, after that, data integration pipelines process the data coming from different sources, Big Data frequency can be increased to near real time. Those two main logical areas are intended to cover different data use cases:
-
Big Data Architecture:
- Operational/production interaction: it covers the operative activities done with data, for example Revenue ingestion, Likelihood to Buy, ADS bidding, etc.. Data goes in the production cycle
- Raw data Storage and Exploration: It covers the users exploration of the data on the Data Lake
- Unstructured/Semistructured: data storage and analytics on unstructured data
- Near Real-Time activities: the interaction with the Production environment is done also through a dedicated near real-time pipeline. This applies to Operational/production interaction and Operational reporting activities
- Advanced analytics: Graph searches on data to see common patterns, advanced machine learning, and AI.
- Operational reporting: Reporting done for operative purposes during the day by day activity of a business department, for example, Pricing optimization, SEM revenue checks for the bidding activities, hourly funnel, etc.
- GCP Sandbox environment: a Google Cloud Project meant to be used as development facility that leverages data lake/other cloud resources (eg. cloud dataproc, cloud BigTable, etc.)
-
DWH Architecture, which is where core data are integrated and consolidated for Business Reporting and Analytics. DWH is intended to support all the analysis to drive strategic decisions based on historical and consolidated data, and the summary reports. It covers all the business reporting on sales, economics, YoY trends, etc. Within the Data Warehouse DB, we also have dedicated schemas/reports, fully granted to the users for Sandbox activities (no batches). If the systems become scheduled, it becomes an Area of Data Warehouse.
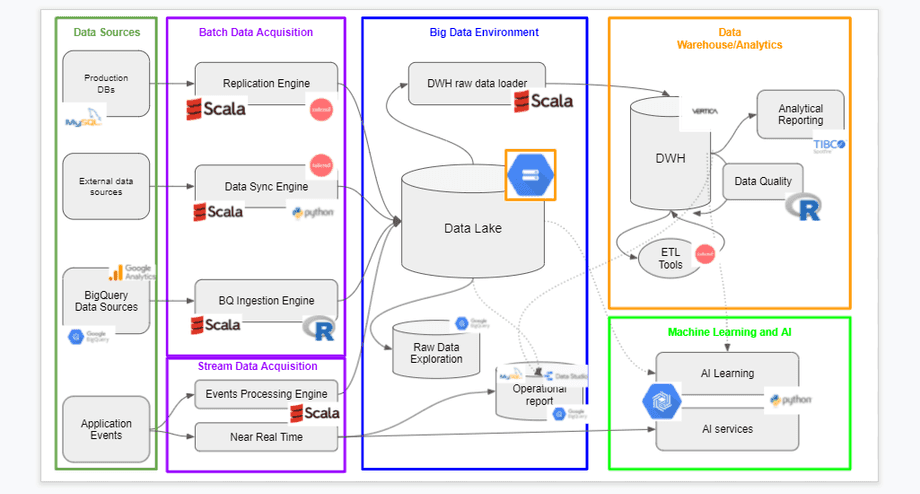
From a technological perspective, DWH and Business reporting are hosted on-premise, whilst the logical area “Big Data” is a set of Projects on Google Cloud Platform, used to organize services and usage inside the Cloud Platform. The main cloud projects are:
- Data Lake: contains the master for raw data with high granularity and maximum history
- AI: serves for AI learning and productionalization of Artificial Intelligence
- Data Analytics: serves for operationalisation of data
- There is also a separate group of projects called Sandbox, that provide every team with a playground for experiments.
Here is an overview of the environment and technologies used in the data platform:
Machine Learning Ecosystem
In lastminute.com we have a dedicated team for Machine Learning and other advanced analytical solutions, known as Strategic Analytics (SA). This team consists of Data Scientists, Advanced Data Analysts and Machine Learning Engineers who all take responsibility for the full Machine Learning technology stack. SA manage the full process for providing Machine Learning solutions:
- Formulating problems in a rigorous mathematical way
- Designing algorithms to solve these problems with cutting edge machine learning models
- Testing and developing these solutions in a simulation environment
- Deploying the best candidate into production for use on the website
- Monitoring the performance of our solutions and improving them with continuous AB testing
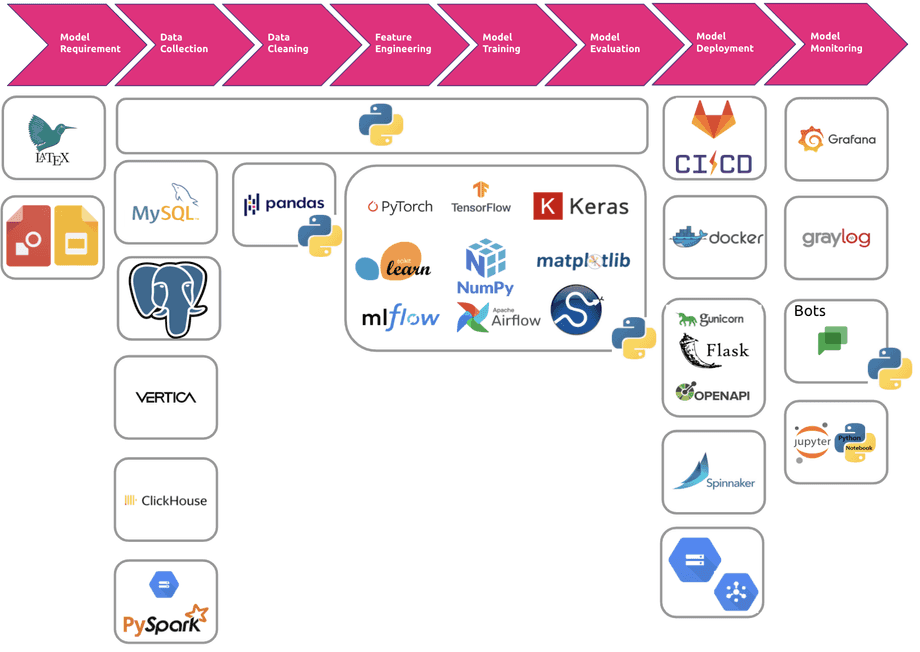
Most of this work is carried out in Python (v3.7+) and its associated ecosystem, which is widely adopted in the Machine Learning community and actively developed by some of the top companies and researchers. The tools we make most use of can be seen in the associated figure.
We first formulate and plan our solutions in LaTeX via Overleaf or the Google Documentation Suite, allowing collaborative editing and development in a distributed remote team.
The data retrieval phase of a machine learning project is the next important part, we created our own Python libraries that, using PySpark, can manage huge amounts of data coming from different sources, such as Avro files in the Data Lake, columnar/relational/object-oriented databases and GCP Bigtable. We adopted PySpark to deal with big data as using RDDs we can easily parallelize in a multi-core and multi-machine fashion. On top of this, we are experimenting with Dask and Ray in order to explore other ways to parallelise data preparation jobs.
After we’ve retrieved our data, we generally build our own custom data structures, making heavy use of python dataclasses and NumPy arrays. This gives us the flexibility to do what we want, whilst also allowing us to interface with pandas library to carry out the more basic data cleaning and analysis tasks. For plotting throughout our workflow we find a combination of Matplotlib and seaborn flexible, easy and powerful.
To carry out the statistical analysis and modelling work we leverage the python scientific stack, with a backbone of Scipy and NumPy, two of the most widely used and robust libraries for such work. For more basic machine learning we find scikit-learn offers most of what we need, while being well maintained and user friendly. For deep learning we like the robustness and flexibility of Tensorflow, often making use of the easier Keras interface. For Bayesian inference we typically utilise TensorFlow Probability, with its wide range of tools.
Our work can also involve more cutting edge research, which we publish at academic conferences or deploy to gain a competitive advantage. In the research and development phase of a project, we often find PyTorch fits us better than Tensorflow.
Once we have a series of models to test, we keep track of experiments we run with MLflow. This library has been a gamechanger for organising and comparing all the different approaches we take to solving problems.
We expose our Machine learning projects to the rest of the website through Python Rest APIs, and describe and document using Swagger. These APIs are built with Gunicorn as a web server and Flask as a web framework, then deployed in Kubernetes environments (both on-cloud and on-prem). We used Gunicorn and Flask stacks for our microservices because it is the most used framework by the Python community, it manages workers automatically and has various web server hooks for extensibility.
Our training procedures are deployed in our production environments (VMs on-prem and on-cloud and on physical machines), using Docker to avoid operating system compatibility/conflict issues with Python dependencies. This also allows us to move the jobs from an environment to another (eg from on-prem to cloud) without effort and issues. To schedule our training procedures we use Apache Airflow, which allows us to describe, using Python, the interactions between different jobs without building custom process managers on our own.
Strategic analytics jobs use standard company Gitlab CI/CD pipelines in order to build the docker image, run tests, and move the image on to the AWS ECR Docker registry and finally trigger a new deployment on Spinnaker.
The models produced by training procedures are stored in GCP Buckets and using GCP Pub/Sub, microservices are notified that a new model is ready and they can reload it without any restart avoiding web services interruption.
To monitor the health of our microservices, metrics are exposed to Grafana using Graphite and Prometheus and logs are collected using Graylog. To monitor the performance of the models we also use custom Google chat bots and adhoc Grafana dashboards.
Want to discover more?
This is the second in a series of articles where we talk about our pink world. If you want to discover more, read:


